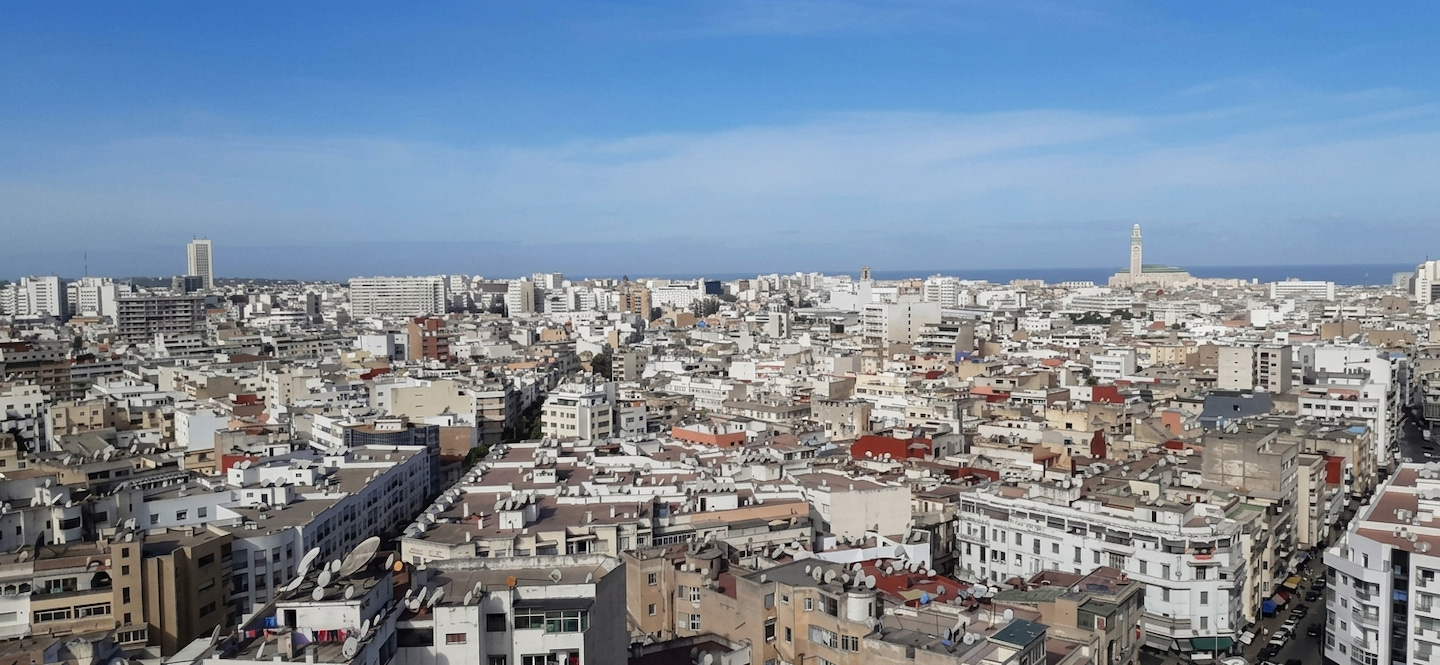
Casablanca · Neighbourhood analysis
Property Prices in Dar Bouazza, Casablanca
Dar Bouazza shows an asking price per sqm comparable to several established Casablanca neighbourhoods, with a longer listing duration than most of them. A look at the latest month's data.
Dar Bouazza is a district on the western outskirts of Casablanca whose property market is tracked on a regular basis by Dar Invest. The data collected makes it possible to monitor asking prices, sizes, and listing durations for sale and rental listings each month. This article presents these indicators and places them in the context of other Casablanca neighbourhoods for which reliable data is available.
How to read the figures in this article
Two concepts appear throughout.
The price per square metre. This is calculated by dividing the price of an apartment by its size. A property of 100 sqm listed at 1,000,000 MAD works out to 10,000 MAD per square metre. This unit makes it possible to compare a studio and a large apartment on the same basis, which would be impossible by looking at total prices alone.
The median. This is the value that splits listings into two equal halves: half of the properties are listed above it, the other half below. It differs from the average, which a single overpriced property would be enough to pull upward. In a heterogeneous market, the median better describes what a buyer actually encounters.
All prices quoted are asking prices set by sellers, never transaction prices. A listing that disappears from platforms is not necessarily a completed sale.
Last month's figures for Dar Bouazza
At the latest reading, October 2026, the number of sale listings retained for Dar Bouazza stands at 91. The median asking price per square metre is 15,957 MAD, with a median size of 123 sqm and a median total asking price of 2,050,000 MAD.
| Indicator | Dar Bouazza (sale) |
|---|---|
| Asking price per sqm | 15,957 MAD |
| Lower range (1st quartile) | 12,859 MAD |
| Upper range (3rd quartile) | 19,184 MAD |
| Median asking price | 2,050,000 MAD |
| Median size | 123 sqm |
| Median listing duration | 116 days |
| Listings retained | 91 |
| Change over the tracked period | +4.5% since March 2026 |
Table: apartments for sale, public listings, figures as of October 2026.
The range between the first and third quartile gives an indication of price dispersion: the central half of listings falls between 12,859 MAD and 19,184 MAD per square metre. A specific property may therefore differ considerably from the median.
Asking price trend
| Month | Median price, in MAD/m² |
|---|---|
| March 2026 | 15,272 |
| April 2026 | 15,496 |
| May 2026 | 15,714 |
| June 2026 | 15,845 |
| July 2026 | 15,836 |
| August 2026 | 16,233 |
| September 2026 | 15,957 |
| October 2026 | 15,957 |
Change over the tracked period: +4.5% since March 2026. The asking price per square metre in Dar Bouazza has risen moderately over the window covered by Dar Invest.
Dar Bouazza in the Casablanca context
The established facts from last month's data allow Dar Bouazza to be positioned relative to several Casablanca neighbourhoods.
Price level. The asking price per sqm in Dar Bouazza is in the same range as that of Maarif, Quartier des Hôpitaux, Les Princesses, and Bourgogne: no ranking can be drawn between these neighbourhoods. Dar Bouazza sits clearly above Oulfa. Racine, on the other hand, shows a notably higher asking price per sqm than Dar Bouazza.
Listing volume. Dar Bouazza has considerably fewer sale listings than each of the other tracked neighbourhoods — Maarif, Oulfa, Quartier des Hôpitaux, Racine, Les Princesses, and Bourgogne. This lower volume makes the median more sensitive to month-to-month variations and calls for caution in interpretation.
Median size. Properties listed in Dar Bouazza are in the same size range as those in Maarif, Quartier des Hôpitaux, and Les Princesses. They are considerably larger than those in Oulfa and Bourgogne. Racine offers considerably larger properties than Dar Bouazza.
| Neighbourhood | Price per sqm | Change | Listings |
|---|---|---|---|
| Dar Bouazza | 15,957 MAD | +4.5% since March 2026 | 91 |
| Maarif | 14,973 MAD | −5.5% since March 2026 | 1,248 |
| Oulfa | 8,462 MAD | −10.9% since March 2026 | 1,258 |
| Quartier des Hôpitaux | 14,067 MAD | −2.7% since March 2026 | 532 |
| Racine | 18,702 MAD | +4.9% since March 2026 | 472 |
| Les Princesses | 17,718 MAD | −4.7% since March 2026 | 420 |
| Bourgogne | 15,139 MAD | −1.1% since March 2026 | 485 |
Table: apartments for sale, public listings, figures as of October 2026.
Listing duration
The median listing duration measures how long a listing remains visible online before disappearing from platforms. A short duration signals a market where properties find a buyer quickly or are withdrawn quickly. A longer duration generally leaves more room to negotiate — with no guarantee, since a listing may disappear for reasons other than a completed sale.
| Month | Median time on market, in days |
|---|---|
| March 2026 | 71 |
| April 2026 | 90 |
| May 2026 | 114 |
| June 2026 | 114 |
| July 2026 | 114 |
| August 2026 | 114 |
| September 2026 | 183 |
| October 2026 | 116 |
In Dar Bouazza, the median listing duration is 116 days at the latest reading. This duration is considerably longer than that observed in Quartier des Hôpitaux, Racine, Les Princesses, and Bourgogne. It is in the same range as that of Maarif and Oulfa.
The rental market and potential gross yield
Dar Invest also tracks rental listings in Dar Bouazza. At the latest reading, the median monthly asking rent per square metre stands at 87 MAD. Change over the tracked period: +1.2% since March 2026. The asking rent per sqm has remained stable over the window covered.
| Month | Median price, in MAD/m² |
|---|---|
| March 2026 | 86 |
| April 2026 | 86 |
| May 2026 | 86 |
| June 2026 | 86 |
| July 2026 | 86 |
| August 2026 | 86 |
| September 2026 | 87 |
| October 2026 | 87 |
A word on gross rental yield, a figure often cited in property investment discussions. It relates one year's rent to the purchase price. An apartment bought for 1,000,000 MAD and rented at 5,000 MAD per month generates 60,000 MAD over the year, a gross yield of 6%. The word "gross" matters: this calculation ignores tax, charges, maintenance, and vacancy periods, all of which reduce the actual return. The ratio between the median asking rent and the median sale price gives a rough order of magnitude; it is not a commitment and does not replace a personalised analysis.
For an MRE buyer
Several points deserve attention for a buyer residing abroad.
The volume of listings in Dar Bouazza is considerably lower than in the most active Casablanca neighbourhoods. A thinner market may mean fewer options at any given moment, but also less competition among buyers. The listing duration, which is longer than in several comparable neighbourhoods, allows more time to process a file from abroad.
The asking price per sqm has risen moderately over the tracked period, while the asking rent has remained stable. These two trajectories are distinct and may evolve independently.
Finally, the process of buying property in Morocco as a non-resident involves specific administrative and tax steps — fund transfers, registration with the land registry, applicable tax regime. These aspects go beyond the scope of this article; a notary or specialist legal adviser is the right point of contact for addressing them.
What these figures do not resolve
Three limitations apply before drawing a purchase decision from this data.
Listing volume is low. Dar Bouazza has considerably fewer listings than the other tracked neighbourhoods. The median therefore rests on a smaller sample, making it more sensitive to the entry or exit of a few atypical properties.
Prices are asking prices, not transaction prices. The gap between the listed price and the price ultimately paid — negotiation — does not appear anywhere in these figures. Listing duration gives an indirect indication of market tension, but does not quantify this gap.
The neighbourhood is not homogeneous. The listings retained cover properties of varying types and locations within Dar Bouazza. A specific property may differ considerably from the medians presented here.
| Month | Number of listings, per month |
|---|---|
| March 2026 | 98 |
| April 2026 | 116 |
| May 2026 | 107 |
| June 2026 | 104 |
| July 2026 | 98 |
| August 2026 | 110 |
| September 2026 | 93 |
| October 2026 | 91 |
Figures as of October 2026.