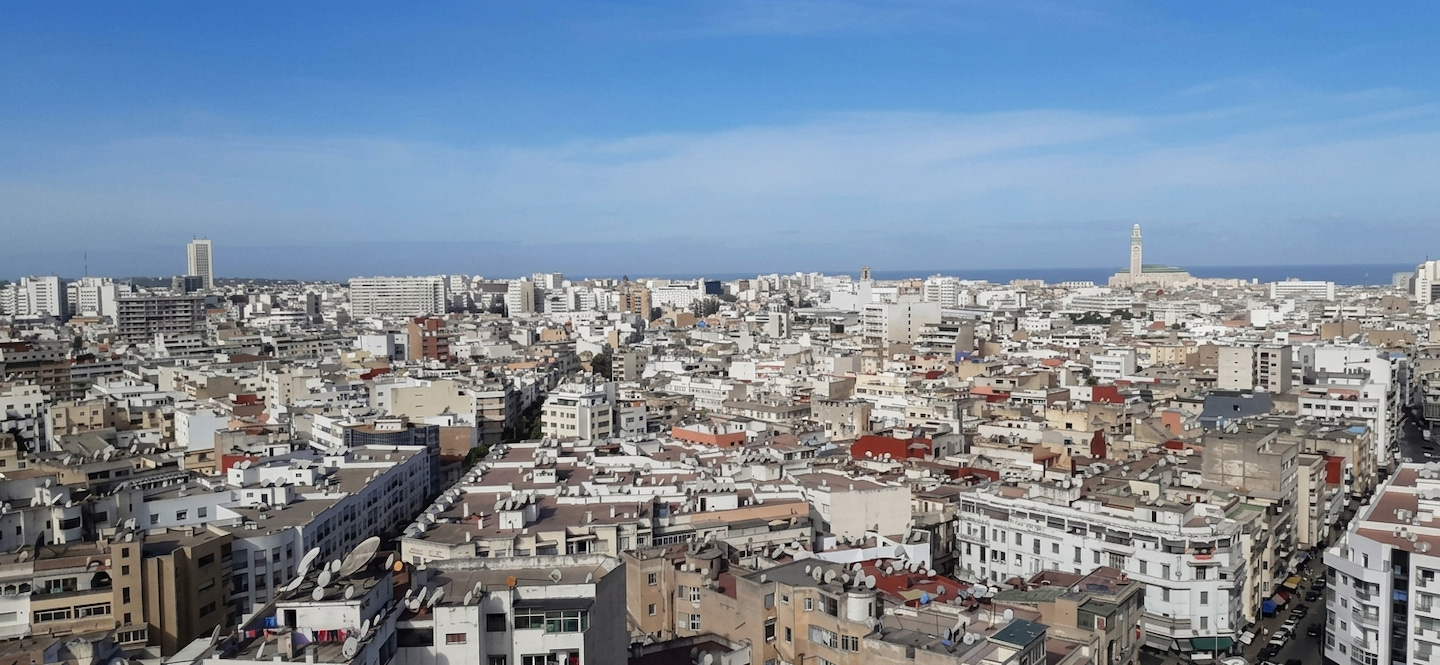
Casablanca · Neighbourhood analysis
Property prices in Californie, Casablanca
Californie shows a stable asking price per sqm over the tracked period, in a market segment where listing volume remains limited. Here is what the latest month's data say, compared with neighbouring neighbourhoods.
Californie is a residential neighbourhood in Casablanca whose sales data now make it possible to produce reliable indicators, even though listing volume there remains lower than in other parts of the city. This article presents the figures for the latest recorded month and places them in the context of Casablanca neighbourhoods for which Dar Invest holds sufficient data.
How to read the figures in this article
Two concepts appear throughout every section below.
Price per square metre. The asking price of an apartment is divided by its floor area. A property of 100 sqm listed at 1,000,000 MAD works out to 10,000 MAD per square metre. This unit makes it possible to compare a small apartment and a large one on the same basis, which would be impossible by looking at total prices alone.
The median. This is the value that splits listings into two equal halves: half the properties are listed above it, the other half below. It is less sensitive than an average to the few outlier properties that can pull figures in one direction or another.
Latest month figures for Californie
At the latest reading, October 2026, the median asking price per sqm for an apartment for sale in Californie stands at 15,569 MAD. The median floor area of listed properties is 130 sqm, for a median total asking price of 1,950,000 MAD.
The central price-per-sqm range runs from 13,630 MAD (lower quartile) to 17,212 MAD (upper quartile). Half of the retained listings fall within this interval; properties outside it exist, but they are less representative of the current market.
These figures are based on 319 listings retained after filtering.
| Month | Median price, in MAD/m² |
|---|---|
| March 2026 | 15,766 |
| April 2026 | 15,943 |
| May 2026 | 15,294 |
| June 2026 | 15,455 |
| July 2026 | 15,757 |
| August 2026 | 15,687 |
| September 2026 | 15,800 |
| October 2026 | 15,569 |
Change over the tracked period: −1.2% since March 2026.
Summary table — Californie (sales)
| Indicator | Californie |
|---|---|
| Median asking price per sqm | 15,569 MAD |
| Median total asking price | 1,950,000 MAD |
| Median floor area | 130 sqm |
| Lower quartile (price per sqm) | 13,630 MAD |
| Upper quartile (price per sqm) | 17,212 MAD |
| Median listing duration | 93 days |
| Listings retained | 319 |
| Change over the tracked period | −1.2% since March 2026 |
Table: apartments for sale, public listings, figures as of October 2026.
Listing duration
Median listing duration measures how long a listing remains visible online before disappearing. A short duration indicates that properties find buyers — or at least leave the platforms — quickly. A longer duration generally leaves more room for negotiation.
| Month | Median time on market, in days |
|---|---|
| March 2026 | 27 |
| April 2026 | 26 |
| May 2026 | 18 |
| June 2026 | 73 |
| July 2026 | 23 |
| August 2026 | 75 |
| September 2026 | 55 |
| October 2026 | 93 |
At the latest reading, the median listing duration in Californie is 93 days. This duration is in the same range as that observed in Maarif, Oulfa, Quartier des Hôpitaux and Racine. It is noticeably longer, however, than what is seen in Les Princesses and Bourgogne.
One clarification is necessary: a listing that disappears is not necessarily a completed sale. The seller may have withdrawn the property, relisted it under a different title, or simply given up. This indicator tracks market attention, not signed deeds.
Californie among Casablanca neighbourhoods
The latest month's data make it possible to position Californie relative to the other neighbourhoods tracked by Dar Invest in Casablanca.
On price per sqm:
- Californie and Maarif show prices in the same range; no ranking between them is possible.
- Californie and Quartier des Hôpitaux show prices in the same range; no ranking between them is possible.
- Californie and Les Princesses show prices in the same range; no ranking between them is possible.
- Californie and Bourgogne show prices in the same range; no ranking between them is possible.
- Californie shows a noticeably higher asking price per sqm than Oulfa.
- Racine shows a noticeably higher asking price per sqm than Californie.
On median floor areas:
Properties for sale in Californie are in the same size range as those in Maarif and Quartier des Hôpitaux. They are noticeably larger than those listed in Oulfa, Les Princesses and Bourgogne. Racine lists properties noticeably larger than those in Californie.
On listing volume:
Californie concentrates a noticeably lower listing volume than Maarif, Oulfa, Quartier des Hôpitaux, Racine, Les Princesses and Bourgogne. This low volume is worth keeping in mind when interpreting the medians: each listing carries more weight in the calculation.
| Neighbourhood | Median price per sqm | Median floor area | Median duration | Listings |
|---|---|---|---|---|
| Californie | 15,569 MAD | 130 sqm | 93 days | 319 |
| Maarif | 14,973 MAD | 122 sqm | 107 days | 1,248 |
| Oulfa | 8,462 MAD | 60 sqm | 92 days | 1,258 |
| Quartier des Hôpitaux | 14,067 MAD | 135 sqm | 86 days | 532 |
| Racine | 18,702 MAD | 176 sqm | 74 days | 472 |
| Les Princesses | 17,718 MAD | 113 sqm | 62 days | 420 |
| Bourgogne | 15,139 MAD | 103 sqm | 67 days | 485 |
Table: apartments for sale, public listings, figures as of October 2026.
The rental market in Californie
Dar Invest also tracks rental listings in Californie. The median asking rent per square metre per month stands at 88 MAD at the latest reading.
Change over the tracked period: −9.3% since March 2026.
| Month | Median price, in MAD/m² |
|---|---|
| March 2026 | 97 |
| April 2026 | 100 |
| May 2026 | 93 |
| June 2026 | 90 |
| July 2026 | 96 |
| August 2026 | 94 |
| September 2026 | 90 |
| October 2026 | 88 |
These rental data make it possible to estimate an indicative gross rental yield. The gross yield relates annual rent to the purchase price: an apartment bought for 1,000,000 MAD and rented at 5,000 MAD per month generates 60,000 MAD in annual rent, equivalent to 6% gross. This calculation ignores charges, taxation, works and void periods, all of which reduce the actual return. It provides an order of magnitude, not a promise of yield.
For an MRE buyer
Several points deserve attention for a buyer residing abroad who is interested in Californie.
Listing volume in Californie is noticeably lower than in the best-supplied neighbouring neighbourhoods. This means that opportunities arise less frequently and that each property put up for sale may attract stronger interest. Monitoring new listings regularly is therefore worthwhile.
The asking price per sqm has been stable over the tracked period for sales, which makes comparison over time straightforward. The rental market, on the other hand, shows a clear decline over the same window: a buyer who intends to rent out the property after purchase would do well to check current rents at the time of their project, rather than relying on older data.
The prices presented here are asking prices set by sellers. The gap between listed price and signed price — negotiation — does not appear anywhere in these figures. Listing duration gives an indication of market tension, but is no substitute for direct knowledge of the local market.
Finally, Californie sits in a price segment in the same range as several established residential neighbourhoods in Casablanca. A buyer comparing several areas can use the table above to identify the neighbourhoods where the available budget opens up the most possibilities.
What these figures do not resolve
Three limitations apply before any decision is made.
Prices are asking prices, not transaction prices. These data describe what sellers hope to obtain. The gap between listed price and transaction price — negotiation — is not captured.
Listing volume in Californie is limited. With 319 listings retained, each atypical property carries more weight in the median than it would in a more active neighbourhood. The figures remain indicative.
A neighbourhood is not homogeneous. Californie covers several pockets whose prices can differ markedly from the median. A specific property may therefore fall well outside the values cited here.
Figures as of October 2026.