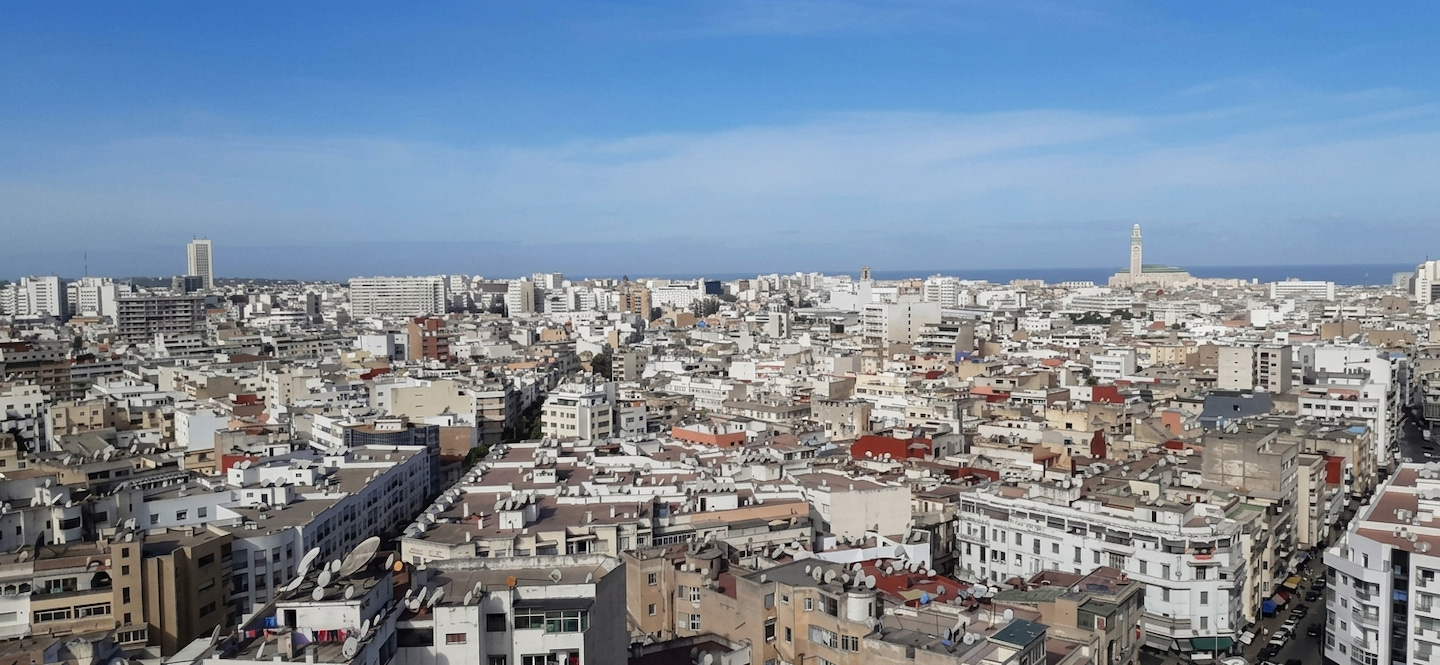
Casablanca · Neighbourhood analysis
Property prices in 2 Mars, Casablanca
Monthly updated sales data for the 2 Mars neighbourhood in Casablanca: price per sqm, median size, listing duration and position relative to comparable districts.
The 2 Mars neighbourhood sits at an intermediate level in Casablanca's price hierarchy. Data collected every month makes it possible to place it relative to several reference districts across the city, without waiting for a one-off study.
How to read the figures in this article
Two concepts appear throughout the sections below.
Price per square metre. The asking price of an apartment is divided by its floor area. A property of 100 sqm listed at 1,000,000 MAD works out to 10,000 MAD per sqm. This unit allows a studio and a large apartment to be compared on the same basis, which would be impossible by looking at total prices alone.
The median. This is the value that splits listings into two equal halves: half the properties are listed above it, the other half below. It is more robust than the average when atypical properties pull figures in one direction or the other.
Last month's figures
At the most recent reading, October 2026, the sales market in 2 Mars is based on 282 retained listings.
| Indicator | 2 Mars |
|---|---|
| Asking price per sqm | 13,021 MAD |
| Range (Q1 – Q3) | 11,732 – 14,552 MAD/sqm |
| Median asking price | 1,705,000 MAD |
| Median size | 134 sqm |
| Median listing duration | 74 days |
| Retained listings | 282 |
| Change over the tracked period: | stable since April 2026 |
Table: apartments for sale, public listings, figures as of October 2026.
The Q1–Q3 range indicates that the central half of listings falls between 11,732 MAD and 14,552 MAD per sqm. Properties outside this interval exist, but they represent the most atypical cases in the market.
Trend in asking price
| Month | Median price, in MAD/m² |
|---|---|
| April 2026 | 13,000 |
| May 2026 | 12,874 |
| June 2026 | 12,745 |
| July 2026 | 13,000 |
| August 2026 | 13,000 |
| September 2026 | 13,000 |
| October 2026 | 13,021 |
Change over the tracked period: stable since April 2026. The asking price per sqm in 2 Mars has been stable over the window covered by the data.
Listing duration
The median listing duration measures how long a listing remains visible online before disappearing. A short duration indicates that properties leave the platforms quickly; a longer duration generally leaves more room to negotiate. A listing that disappears is not necessarily sold: the seller may have withdrawn it, reposted it under a different title, or simply abandoned it.
| Month | Median time on market, in days |
|---|---|
| April 2026 | 65 |
| May 2026 | 53 |
| June 2026 | 81 |
| July 2026 | 82 |
| August 2026 | 80 |
| September 2026 | 66 |
| October 2026 | 74 |
| Month | Number of listings, per month |
|---|---|
| April 2026 | 44 |
| May 2026 | 56 |
| June 2026 | 59 |
| July 2026 | 76 |
| August 2026 | 94 |
| September 2026 | 97 |
| October 2026 | 282 |
2 Mars among comparable Casablanca districts
Last month's data makes it possible to place 2 Mars within a set of Casablanca districts tracked by Dar Invest.
Position in the price hierarchy. The asking price per sqm in 2 Mars is in the same range as that of Maarif and Quartier des Hôpitaux: no ranking is possible between these three districts. It is noticeably higher than in Oulfa. Racine and Les Princesses, on the other hand, show a noticeably higher price per sqm than 2 Mars.
Recent trends. Over the tracked window, the price in 2 Mars is stable, while Maarif and Oulfa record a clear decline, and Quartier des Hôpitaux and Les Princesses show a moderate decline. Racine, for its part, is showing a moderate increase.
Size of listed properties. The median size in 2 Mars is in the same range as that of Maarif and Quartier des Hôpitaux. Properties in 2 Mars are noticeably larger than those listed in Oulfa. The median size in 2 Mars is in the same range as that of Les Princesses, with no ranking possible between them. Racine offers noticeably larger properties than 2 Mars.
Listing volume. The 2 Mars market is noticeably less active than those of Maarif, Oulfa, Quartier des Hôpitaux, Racine and Les Princesses. This lower volume makes the median more sensitive to month-to-month variation.
Listing duration. The median listing duration in 2 Mars is in the same range as that of Oulfa, Quartier des Hôpitaux, Racine and Les Princesses. Maarif shows a noticeably longer listing duration than 2 Mars.
| District | Price per sqm | Change | Median size | Listing duration | Listings |
|---|---|---|---|---|---|
| 2 Mars | 13,021 MAD | stable since April 2026 | 134 sqm | 74 days | 282 |
| Maarif | 14,973 MAD | −5.5% since March 2026 | 122 sqm | 107 days | 1,248 |
| Oulfa | 8,462 MAD | −10.9% since March 2026 | 60 sqm | 92 days | 1,258 |
| Quartier des Hôpitaux | 14,067 MAD | −2.7% since March 2026 | 135 sqm | 86 days | 532 |
| Racine | 18,702 MAD | +4.9% since March 2026 | 176 sqm | 74 days | 472 |
| Les Princesses | 17,718 MAD | −4.7% since March 2026 | 113 sqm | 62 days | 420 |
Table: apartments for sale, public listings, figures as of October 2026.
For an MRE buyer
Several points deserve attention before starting a purchase process in 2 Mars.
The number of retained listings is noticeably lower than in Maarif or Oulfa. This means that the choice available at any given time is more limited, and that the median can shift more from one month to the next without the market having genuinely changed level.
The prices cited in this article are asking prices set by sellers. The gap between the listed price and the price ultimately signed — the negotiation margin — does not appear anywhere in this data. Listing duration gives an indirect indication of market tension, but says nothing about the actual conditions of a transaction.
Rental data for 2 Mars does not exceed the reliability threshold set by Dar Invest. No rental figures or gross rental yield estimates are therefore available for this district in this article.
Finally, the administrative steps involved in purchasing property in Morocco from abroad — fund transfers, the role of the notary, registration timelines — are matters for legal and tax professionals. This article does not constitute legal or tax advice.
What these figures do not resolve
Three limitations apply before drawing any purchase conclusion.
Prices are asked, not signed. A listing that disappears from the platforms is not necessarily a completed sale. This data describes sellers' intentions, not actual transactions.
The district is not homogeneous. The median summarises all available listings, but specific properties can differ noticeably depending on their floor, condition or exact location within the district.
Volume is limited. With a number of listings noticeably lower than in the most active neighbouring districts, each month can produce a slightly different median without this reflecting a genuine market movement. Trends over several months are more reliable than one-off variations.
Figures as of October 2026.