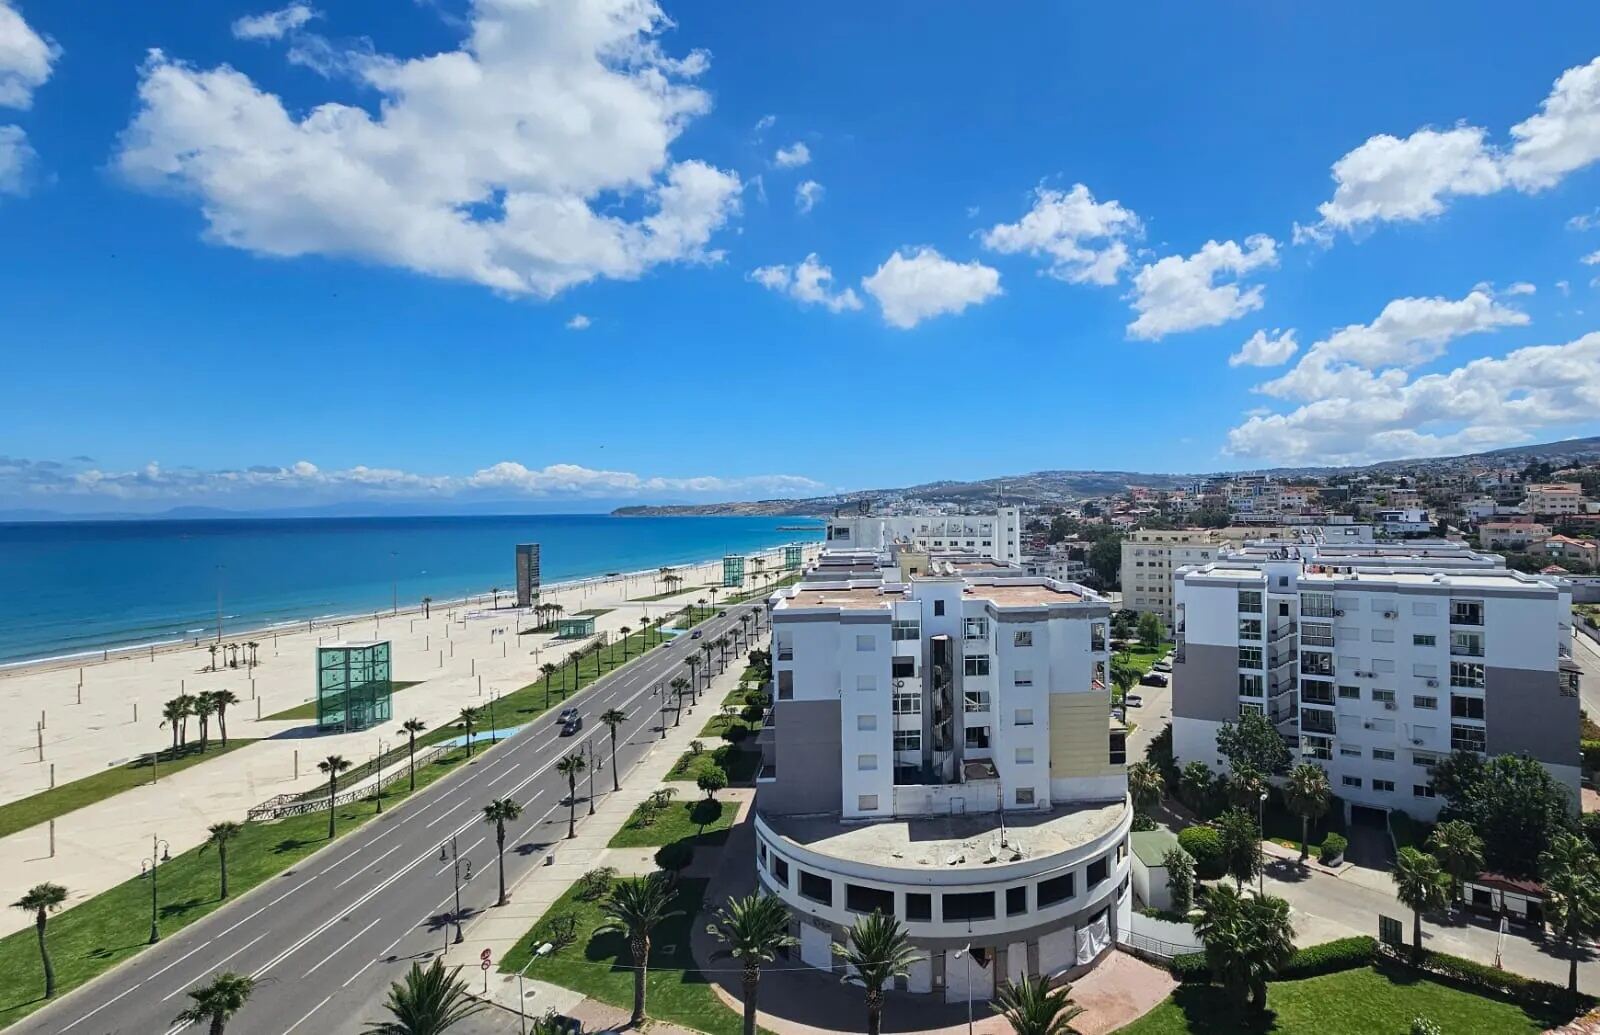
Tangier · Neighbourhood analysis
Buying in Marjane, Tangier: what the listings show
Marjane shows an asking price per sqm well below that of Centre Ville and Malabata. A review of the available indicators for buyers prospecting in Tangier.
Marjane is one of the residential neighbourhoods in Tangier for which Dar Invest collects sale and rental listings. The data below covers asking prices set by sellers, not transaction prices. It allows the neighbourhood to be positioned relative to two other areas of the city with reliable data: Centre Ville and Malabata.
How to read the figures in this article
Two concepts recur throughout the following sections.
Price per square metre. The listed price of an apartment is divided by its floor area. A property of 100 sqm offered at 1,000,000 MAD works out to 10,000 MAD per square metre. This unit makes it possible to compare a studio and a large apartment without the difference in size distorting the reading.
The median. This is the value that splits the listings into two equal halves: half the properties are offered above it, the other half below. It is more robust than an average against atypical properties that pull figures up or down.
Marjane in figures at the latest data point
At the latest recorded month, September 2026, the sale listings retained for Marjane are as follows.
| Indicator | Marjane |
|---|---|
| Asking price per sqm | 11,258 MAD |
| Lower range (1st quartile) | 9,880 MAD |
| Upper range (3rd quartile) | 14,000 MAD |
| Median asking price | 960,000 MAD |
| Median floor area | 80 sqm |
| Median listing duration | 0 days |
| Listings retained | 69 |
| Change over the tracked period | +25.9% since March 2026 |
Table: apartments for sale, public listings, figures as of September 2026.
The range between the first and third quartile indicates the spread of asking prices for the central half of listings. A specific property may fall outside this range without being exceptional.
Asking price trend
| Month | Median price, in MAD/m² |
|---|---|
| March 2026 | 8,940 |
| April 2026 | 10,000 |
| May 2026 | 10,000 |
| June 2026 | 11,953 |
| August 2026 | 11,071 |
| September 2026 | 11,258 |
Change over the tracked period: +25.9% since March 2026. The asking price per sqm in Marjane has risen clearly over the window covered by the data.
Listing duration
The median listing duration measures how long a listing remains visible online before disappearing. A short duration indicates that properties leave the platforms quickly. A longer duration generally leaves more room to negotiate.
| Month | Median time on market, in days |
|---|---|
| March 2026 | 4 |
| April 2026 | 4 |
| May 2026 | 5 |
| June 2026 | 4 |
| August 2026 | 6 |
| September 2026 | 0 |
One clarification is necessary: a listing that disappears has not necessarily been sold. The seller may have withdrawn it, reposted it under a different title, or abandoned the process without finding a buyer. This indicator tracks market attention, not signed deeds.
Listing volume
| Month | Number of listings, per month |
|---|---|
| March 2026 | 56 |
| April 2026 | 123 |
| May 2026 | 78 |
| June 2026 | 47 |
| August 2026 | 54 |
| September 2026 | 69 |
The number of listings retained conditions the reliability of the medians. A low volume can shift the figures from one month to the next without the market having genuinely changed.
Comparison with Centre Ville and Malabata
Two other neighbourhoods in Tangier have reliable data: Centre Ville and Malabata. The established facts at the latest data point allow the following comparisons.
Price per square metre. The asking price per sqm in Centre Ville is well above that of Marjane. Malabata also shows an asking price per sqm well above Marjane. Between Centre Ville and Malabata, Malabata sits clearly higher.
Property size. Properties for sale in Centre Ville are considerably larger than those in Marjane. The same applies to Malabata, whose median floor area is well above that of Marjane. Centre Ville and Malabata show median floor areas of a similar order.
Listing volume. Centre Ville concentrates considerably more sale listings than Marjane. Between Marjane and Malabata, volumes are of a similar order; no reliable ranking between them is possible.
| Indicator | Marjane | Centre Ville | Malabata |
|---|---|---|---|
| Asking price per sqm | 11,258 MAD | 14,982 MAD | 21,096 MAD |
| Median asking price | 960,000 MAD | 1,814,250 MAD | 2,450,000 MAD |
| Median floor area | 80 sqm | 107 sqm | 114 sqm |
| Listings retained | 69 | 150 | 84 |
Table: apartments for sale, public listings, figures as of September 2026.
Recent trends differ across neighbourhoods. The asking price per sqm has risen clearly in Marjane and Malabata over the tracked window, while Centre Ville records a moderate decline. These trends relate to asking prices and may shift from one month to the next.
The rental market in Marjane
Dar Invest also collects rental listings for Marjane. The median asking rent per square metre per month stands at 70 MAD at the latest data point. The asking rental price has risen moderately over the tracked window.
This data makes it possible to estimate a gross rental yield by relating annual rents to the purchase price. For example, an apartment bought for 1,000,000 MAD and rented at 5,000 MAD per month generates 60,000 MAD over the year, representing a 6% gross yield. The word "gross" matters: this calculation does not account for charges, maintenance, vacancy periods, or applicable taxation. The net result is always lower.
For an MRE buyer
Buyers residing abroad who are prospecting in Tangier will find in Marjane an asking price per sqm well below that of Centre Ville and Malabata. Properties there are also considerably smaller than in those two neighbourhoods, which translates into different entry prices even at a comparable price per sqm.
The volume of listings in Marjane is more limited than in Centre Ville. This may make selection quicker, but also reduces the scope for direct comparison between similar properties.
The available rental data allows a rough estimate of gross yield to be made, without that figure constituting any form of commitment. The actual conditions of a rental investment depend on factors that listings do not capture.
Nothing in this data constitutes tax or legal advice. The rules applicable to acquisitions made by non-residents are a matter for qualified professionals.
What these figures do not resolve
Three limitations deserve to be stated clearly.
Asking prices, not transaction prices. All values cited here are prices displayed by sellers. Negotiation, which can be significant, does not appear anywhere in these figures.
Internal heterogeneity. A neighbourhood is not homogeneous. The listings retained for Marjane cover properties whose characteristics vary. A specific apartment may differ considerably from the median without being atypical.
Volume and reliability. When the number of listings is limited, the median can shift from one month to the next due to a few properties entering or leaving the sample, without the market having genuinely moved. The number of listings retained is shown in the table to allow this risk to be assessed.
Figures as of September 2026.