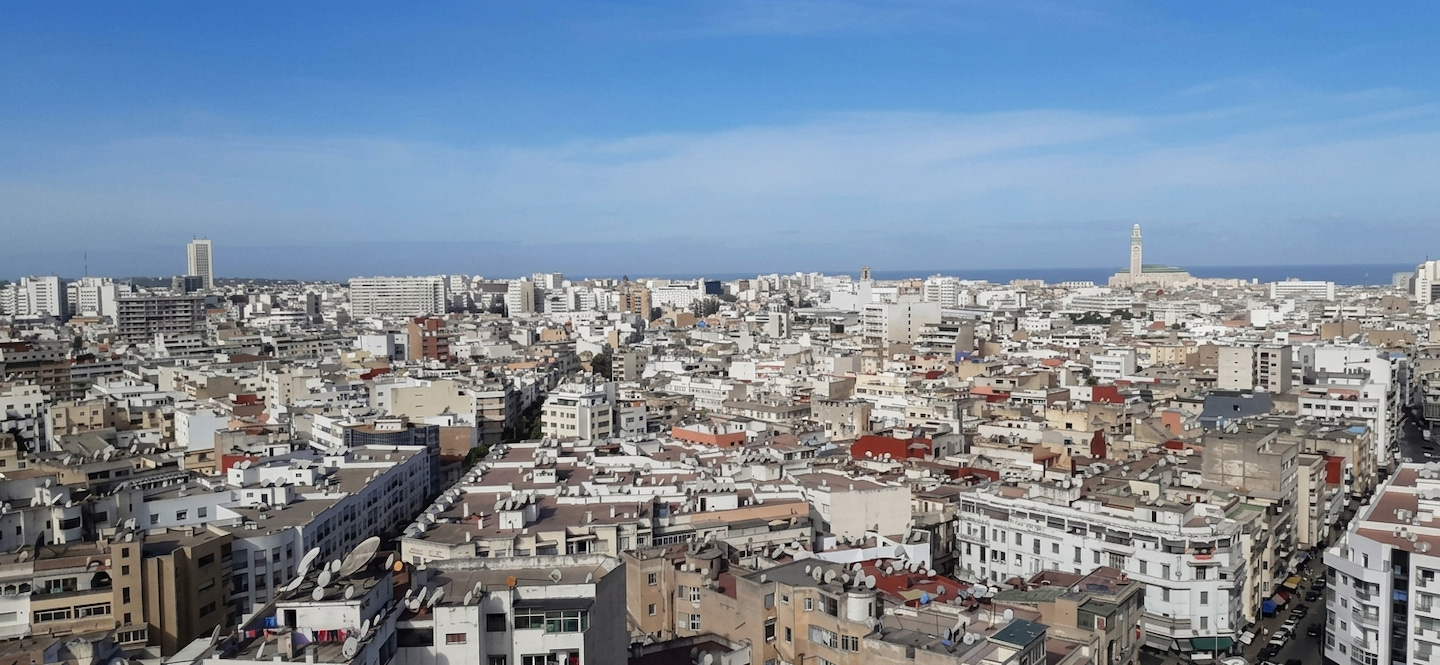
Casablanca · Neighbourhood analysis
Buying in Finance City Casablanca: asking price significantly higher than in other tracked neighbourhoods
Finance City posts the highest asking price per sqm among the Casablanca neighbourhoods tracked by Dar Invest, with a listing duration significantly shorter than its neighbours. A closer look at the figures from the latest snapshot.
Finance City carries a modest volume of sale listings compared to Casablanca's larger residential neighbourhoods. This thin market makes every indicator more sensitive to one-off variations, which is reason enough to read the figures below with caution. That said, the available data are sufficient to position this neighbourhood reliably against its neighbours.
How to read the figures in this article
Two concepts come up in every section, and it is worth defining them upfront.
Price per sqm. The listed price of an apartment is divided by its floor area. A property of 100 sqm listed at 1,000,000 MAD works out to 10,000 MAD per sqm. This unit makes it possible to compare a studio and a large apartment on the same basis, which would be impossible by looking at total prices alone.
The median. This is the value that splits listings into two equal halves: half the properties are listed above it, the other half below. It is more robust than the average against atypical properties that pull figures up or down. In a heterogeneous market like Casablanca, the median better describes what a buyer actually encounters.
Figures from the latest snapshot
In the latest month on record, October 2026, the Finance City sales market is based on 144 retained listings. The median asking price per sqm stands at 24,532 MAD, for a median listed property at 3,225,000 MAD with a median floor area of 126 sqm.
The central price range runs from 20,873 MAD per sqm (lower quartile) to 28,100 MAD (upper quartile). Half of the retained listings fall within this interval; properties outside this range exist, but they are less representative of the current market.
| Indicator | Finance City (sales) |
|---|---|
| Asking price per sqm | 24,532 MAD |
| Lower quartile (sqm) | 20,873 MAD |
| Upper quartile (sqm) | 28,100 MAD |
| Median asking price | 3,225,000 MAD |
| Median floor area | 126 sqm |
| Median listing duration | 14 days |
| Retained listings | 144 |
| Change over the tracked period | −4.4% since May 2026 |
Table: apartments for sale, public listings, figures as of October 2026.
Asking price trend
The chart below traces the trajectory of the median asking price per sqm in Finance City over the window tracked by Dar Invest.
| Month | Median price, in MAD/m² |
|---|---|
| May 2026 | 25,661 |
| June 2026 | 25,000 |
| July 2026 | 24,143 |
| August 2026 | 24,138 |
| September 2026 | 24,234 |
| October 2026 | 24,532 |
Change over the tracked period: −4.4% since May 2026. The asking price per sqm in Finance City has declined moderately over this window. This trend covers prices listed by sellers, not transaction prices: it reflects what sellers hope to obtain, not what buyers have actually paid.
Finance City against other Casablanca neighbourhoods
The neighbourhoods compared below are those for which Dar Invest holds reliable data as of October 2026.
Finance City posts an asking price per sqm significantly higher than Maarif, Oulfa, Quartier des Hôpitaux, Racine, Les Princesses and Bourgogne. Among these neighbourhoods, Racine and Les Princesses sit at a broadly similar level to each other, and significantly above Maarif, Quartier des Hôpitaux and Bourgogne, which are themselves significantly above Oulfa. Finance City therefore stands clearly at the top of all tracked neighbourhoods.
| Neighbourhood | Price per sqm | Change over tracked period |
|---|---|---|
| Finance City | 24,532 MAD | −4.4% since May 2026 |
| Racine | 18,702 MAD | +4.9% since March 2026 |
| Les Princesses | 17,718 MAD | −4.7% since March 2026 |
| Maarif | 14,973 MAD | −5.5% since March 2026 |
| Quartier des Hôpitaux | 14,067 MAD | −2.7% since March 2026 |
| Bourgogne | 15,139 MAD | −1.1% since March 2026 |
| Oulfa | 8,462 MAD | −10.9% since March 2026 |
Table: apartments for sale, median asking price per sqm, public listings as of October 2026.
On the trend side, Maarif and Oulfa show a clear decline over the tracked window, while Racine is up moderately and Bourgogne is stable. Finance City, Quartier des Hôpitaux and Les Princesses each show a moderate decline.
Property size and listing volume
The median floor area of properties for sale in Finance City is broadly in line with what is observed in Maarif, Quartier des Hôpitaux and Les Princesses. It is significantly larger than in Oulfa and Bourgogne. Racine offers properties significantly larger than Finance City.
On volume, Finance City carries significantly fewer listings than all other compared neighbourhoods. Maarif and Oulfa dominate by volume, at a broadly similar level to each other. Quartier des Hôpitaux, Racine, Les Princesses and Bourgogne sit at a broadly similar volume to each other, significantly below Maarif and Oulfa, but significantly above Finance City.
A thin listing market has two practical consequences: medians are more sensitive to the arrival or withdrawal of a single property, and the choice available at any given moment remains limited.
Listing duration
The median listing duration measures how long a listing stays visible online before disappearing. A short duration indicates that properties leave the platforms quickly. A long duration generally leaves more room to negotiate.
| Month | Median time on market, in days |
|---|---|
| May 2026 | 9 |
| June 2026 | 10 |
| July 2026 | 10 |
| August 2026 | 11 |
| September 2026 | 10 |
| October 2026 | 14 |
As of October 2026, the median listing duration in Finance City is 14 days. All other compared neighbourhoods show a significantly longer duration: Maarif, Oulfa, Quartier des Hôpitaux, Racine, Les Princesses and Bourgogne all sit significantly above this figure.
One clarification is in order: a listing that disappears has not necessarily found a buyer. The seller may have withdrawn it, reposted it under a different title, or abandoned the process without completing a sale. The indicator tracks market attention, not signed deeds at the notary.
| Month | Number of listings, per month |
|---|---|
| May 2026 | 40 |
| June 2026 | 42 |
| July 2026 | 56 |
| August 2026 | 61 |
| September 2026 | 80 |
| October 2026 | 144 |
The rental market and potential gross yield
Dar Invest also tracks rental listings in Finance City. In the latest snapshot, the median asking rent stands at 138 MAD per sqm per month. Change over the tracked period: +4.5% since March 2026. The asking rent per sqm has risen moderately over the tracked window, which contrasts with the moderate decline observed on the sales side.
A word on gross rental yield, a notion often cited in discussions among MRE. It relates annual rent to the purchase price. An apartment bought for 1,000,000 MAD and rented at 5,000 MAD per month generates 60,000 MAD over the year, equivalent to a 6% gross yield. This calculation ignores taxation, service charges, maintenance costs, vacancy periods and management fees. The actual net return is always lower than the gross figure, sometimes considerably so. Dar Invest's data make it possible to calculate a rough gross estimate from the sales and rental medians, but this ratio is not a profitability projection.
For an MRE buyer
Finance City has several characteristics worth weighing before taking any steps.
The asking price per sqm is significantly higher than in all other tracked Casablanca neighbourhoods. The entry ticket is therefore meaningfully higher, for a comparable floor area, than in neighbourhoods such as Maarif or Racine.
The listing duration, significantly shorter than elsewhere, suggests that available properties either find a buyer quickly or disappear from the platforms rapidly. For a buyer monitoring the market from abroad, this means having a representative on the ground capable of acting quickly, or being prepared to travel at specific times.
Listing volume is modest. The supply available at any given moment is limited, and medians can shift from one month to the next under the influence of a small number of properties. It is advisable to follow the data over several months rather than relying on a single snapshot.
No tax or legal advice can be provided here. The conditions of acquisition for non-residents, the treatment of rental income and the procedures for repatriating funds require specialist consultation.
What these figures do not resolve
Three limitations must be acknowledged before drawing any purchasing conclusion.
Prices are asking prices, not transaction prices. All values cited in this article are prices listed by sellers. The gap between the asking price and the price ultimately signed — the negotiation — does not appear anywhere in this data.
Listing volume is low. Finance City is the neighbourhood with the fewest listings among those compared here. A median calculated on a small number of properties is more volatile and less representative than one calculated on a large number of listings.
The neighbourhood is not homogeneous. Properties for sale in Finance City cover a range of types and quality levels. A specific property may differ significantly from the medians cited, in either direction.
Figures as of October 2026.